By Eric Andrew Kristof, RN, CAHIMS | Healthcare IT Professional | HIMSS Arkansas Chapter Member
About This Series: The HIMSS Word of The Day is a running blog series drawing from the HIMSS Dictionary of Health Information and Technology Terms, Acronyms, and Organizations, 6th Edition (2025) — the authoritative reference for healthcare IT professionals and the primary study resource for CAHIMS and CPHIMS certification. Each post paraphrases the term in plain language, grounds it in real-world healthcare IT context, and adds a bedside nursing perspective you won’t find in a textbook.
📖 The Term: Control Chart
Source: HIMSS Dictionary of Health Information and Technology Terms, Acronyms, and Organizations, 6th Edition (2025)
🔍 Plain-Language Definition
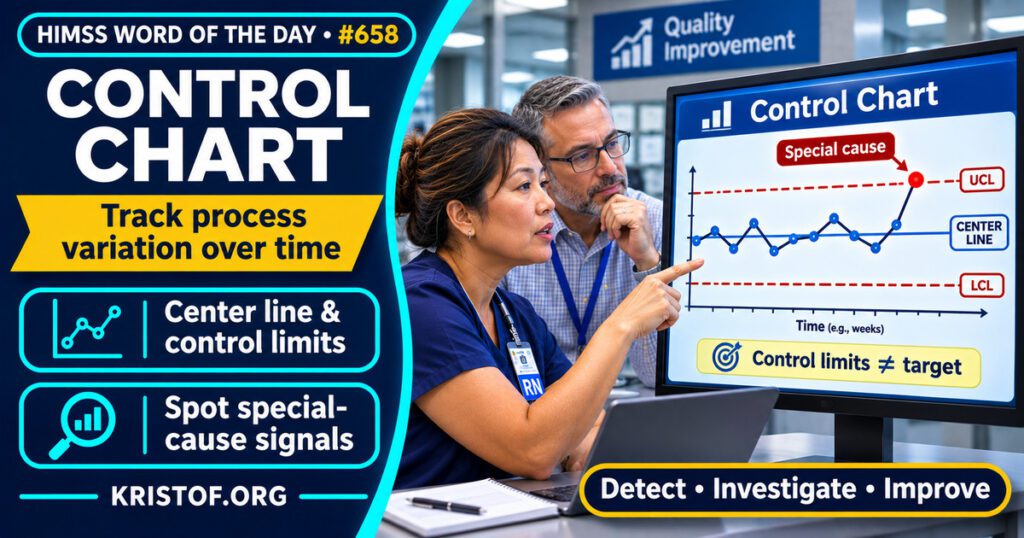
The HIMSS Dictionary describes a control chart as a graph that plots the results of a process over time with control limits drawn on it. The scatter of points shows whether the process is staying inside its limits and whether the variation looks random or systematic.
Koetsier and colleagues (2012) note that Shewhart control charts are typically used in one or more phases of the Plan-Do-Study-Act (PDSA) cycle to monitor process and outcome data pulled from clinical information systems over time. In their criteria, control limits sit three standard deviations from the mean. Mohammed and colleagues (2008) illustrate four commonly used charts: the xmr chart, p-chart, u-chart, and c-chart.
| Chart part | What it shows | Why it matters |
|---|---|---|
| Data points | The measure over time, such as complications per quarter | The pattern across points is what is judged |
| Center line | The average of the measure | The reference for the pattern |
| Control limits | Boundaries set from the data, three standard deviations from the mean in the criteria above | Points outside them, or odd patterns, suggest a special cause |
| Signal rules | Patterns that count as evidence of special cause variation | Koetsier and colleagues extracted a limit of four such rules |
⚠️ Exam Alert: Control limits come from the process’s own data, while a target or goal is chosen by people. A process can sit inside its control limits and still miss its target. Also keep control chart distinct from a run chart, which plots data over time without control limits.
🌐 Why It Matters: Real-World Healthcare IT Context
Control charts are used in healthcare quality work, and the published evidence ranges from a randomized trial to reviews of how well charts are built. Each source has limits, which are noted below.
A randomized trial. Skinner and colleagues (2024) reported an economic analysis of the SHEWHART cluster-randomized trial. It included 40 surgical departments in France and 155,362 adult patients who had hernia repair, cholecystectomy, appendectomy, bariatric, colorectal, hepatopancreatic, or esophageal and gastric surgery. In the 20 intervention hospitals, teams received quarterly control charts for inpatient death, intensive care stay, reoperation, and severe complications. A surgeon and a collaborator, who could be a surgeon, anesthesiologist, or nurse, were trained to run team meetings, display posters in operating rooms, keep logbooks, and design improvement plans. After the intervention, hospital bed-days within 30 days of surgery fell by 3.3 percent (95 percent confidence interval 2.1 to 4.6 percent) compared with control hospitals. Costs reimbursed by the insurer fell by 1.3 percent (95 percent confidence interval 0.0 to 2.6 percent), which is a wide and borderline interval. The authors estimate that 8,910 bed-days were avoided. Because the charts came with training, meetings, and improvement plans, the trial tested a package, not charts alone.
Reviews of use. Thor and colleagues (2007) reviewed 57 empirical studies from 311 articles, published from 1990 to 2004. They found statistical process control used in a wide range of settings and described 12 categories of benefits, 6 of limitations, and 10 of barriers. They say its power hinges on correct and smart application and catalog 11 approaches to that application, including risk adjustment and data stratification. Waqas and colleagues (2024) combined a systematic review of 73 of 223 articles with a bibliometric analysis of 184 articles. They report the USA as the top user with 33 percent of applications, epidemiology as the leading health department with 28 percent, and exponentially weighted moving average charts as the most popular worldwide. Bibliometric counts describe publication patterns, not quality of care.
How well charts are built. Koetsier and colleagues (2012) reviewed 34 quality improvement studies that presented 64 control charts. The criterion of using 10 to 35 data points was the least followed, with 48.4 percent non-adherence. Skewed data were not transformed when they should have been in 43.7 percent, a stable first phase was missing in 40.0 percent of comparisons between PDSA phases, and more than four rules for special cause variation were used in 14.1 percent. All charts used limits at three standard deviations. The authors say higher adherence will reduce the risk of incorrect conclusions. The review covers studies published up to its 2012 date.
What I could not confirm. I did not find a trial of control charts on a nursing unit measure, so I cannot say how the surgical result would carry over. I did not verify the economic estimates beyond the abstract, and I read abstracts only, not full texts.
Common control chart problems:
- Too few or too many data points for a stable limit
- Comparing phases when the earlier phase was not stable
- Skewed data left untransformed
- Using many signal rules, which the review’s criteria discourage
- Showing a chart without any team review or improvement plan
What supports effective control charts:
- Choosing the right chart type for the data, as the tutorial illustrates
- Risk adjustment or stratification where patient mix differs
- Trained teams that review the chart together and keep logs
- Improvement plans tied to signals
- Documenting the data source and the rules used
🏥 The Nurse’s Perspective: Clinical, Bedside, & Workflow
Nurses are part of the control chart story, starting with the trial’s named collaborator role.
At the Bedside
A nurse whose unit tracks falls, pressure injuries, or line infections may see a chart posted near the unit. A point that moves does not always mean practice changed, and a chart helps separate routine variation from a pattern worth investigating. These measures are examples of what a unit could chart, not findings from the studies above.
In Clinical Workflow
In the SHEWHART trial, a nurse could serve as the collaborator paired with a surgeon to conduct chart review meetings, post charts, keep logbooks, and design improvement plans. That shows nurses can help run the follow-up. The trial abstract does not say how many collaborators were nurses.
In EHR Implementation (Go-Live Perspective)
During an Epic Go-Live, documentation workflows change, and a change in how a measure is captured can move a chart without any change in care. That is an inference from how charts work, not a finding from the sources. Koetsier and colleagues note that the data feeding these charts are typically abstracted from clinical information systems, so analysts and nurse leaders can mark go-live dates on charts and check definitions before reading a shift.
🎓 CAHIMS / CPHIMS & HIMSS Perspective
CAHIMS Exam Domain Mapping
Control charts support measurement and improvement work:
| CAHIMS Domain | How Control Charts Appear |
|---|---|
| Healthcare & Technology Environments | Quality and safety measurement in healthcare organizations |
| Clinical Informatics | Using clinical data to monitor processes and outcomes |
| Healthcare Information & Systems Management | Data sources, definitions, and reporting tools for charts |
| Management & Leadership | Improvement cycles, targets, and team review of results |
Key Terms to Know Alongside Control Chart
- Statistical process control (SPC) — methods that use data over time to monitor and improve a process
- Special cause variation — change in a process that has an identifiable source beyond routine variation
- Run chart — a plot of data over time without control limits
- PDSA cycle — Plan-Do-Study-Act, a repeated cycle for testing changes
- Key performance indicator (KPI) — a measure used to track progress toward a goal
- Quality improvement — systematic efforts to improve care processes and outcomes
HIMSS Organizational Position
HIMSS offers education and research on health information and technology topics through its Resource Center. Members can find related information on the HIMSS Resource Center page.
🧭 More HIMSS Word of The Day Terms
Related terms in the Data and Analytics series:
Browse all Data and Analytics terms or the A–Z glossary.
🔗 Explore Further: External References
- Skinner et al. (2024), BMJ Quality and Safety — Economic analysis of surgical outcome monitoring using control charts: the SHEWHART cluster randomised trial https://pubmed.ncbi.nlm.nih.gov/37553238/
- Thor et al. (2007), Quality and Safety in Health Care — Application of statistical process control in healthcare improvement: systematic review https://pubmed.ncbi.nlm.nih.gov/17913782/
- Waqas et al. (2024), International Journal for Quality in Health Care — Control charts in healthcare quality monitoring: a systematic review and bibliometric analysis https://pubmed.ncbi.nlm.nih.gov/39018022/
- Koetsier et al. (2012), Methods of Information in Medicine — Control charts in healthcare quality improvement. A systematic review on adherence to methodological criteria https://pubmed.ncbi.nlm.nih.gov/22476327/
- Mohammed et al. (2008), Quality and Safety in Health Care — Plotting basic control charts: tutorial notes for healthcare practitioners https://pubmed.ncbi.nlm.nih.gov/18385409/
- HIMSS — Resource Center https://www.himss.org/resource-center
Term source: HIMSS Dictionary of Health Information and Technology Terms, Acronyms, and Organizations, 6th Edition (2025). All definitions in this series are paraphrased for editorial purposes. Readers are encouraged to consult the primary source for exact language.
Eric Andrew Kristof, RN, CAHIMS is a Healthcare IT professional and HIMSS Arkansas Chapter member based in Hot Springs Village, AR, with hands-on Epic Go-Live experience and a diverse healthcare and IT background. He writes at kristof.org at the intersection of clinical care and healthcare technology.
Leave a Reply