By Eric Andrew Kristof, RN, CAHIMS | Healthcare IT Professional | HIMSS Arkansas Chapter Member
About This Series: The HIMSS Word of The Day is a running blog series drawing from the HIMSS Dictionary of Health Information and Technology Terms, Acronyms, and Organizations, 6th Edition (2025) — the authoritative reference for healthcare IT professionals and the primary study resource for CAHIMS and CPHIMS certification. Each post paraphrases the term in plain language, grounds it in real-world healthcare IT context, and adds a bedside nursing perspective you won’t find in a textbook.
📖 The Term: Infographics
Source: HIMSS Dictionary of Health Information and Technology Terms, Acronyms, and Organizations, 6th Edition (2025)
🔍 Plain-Language Definition
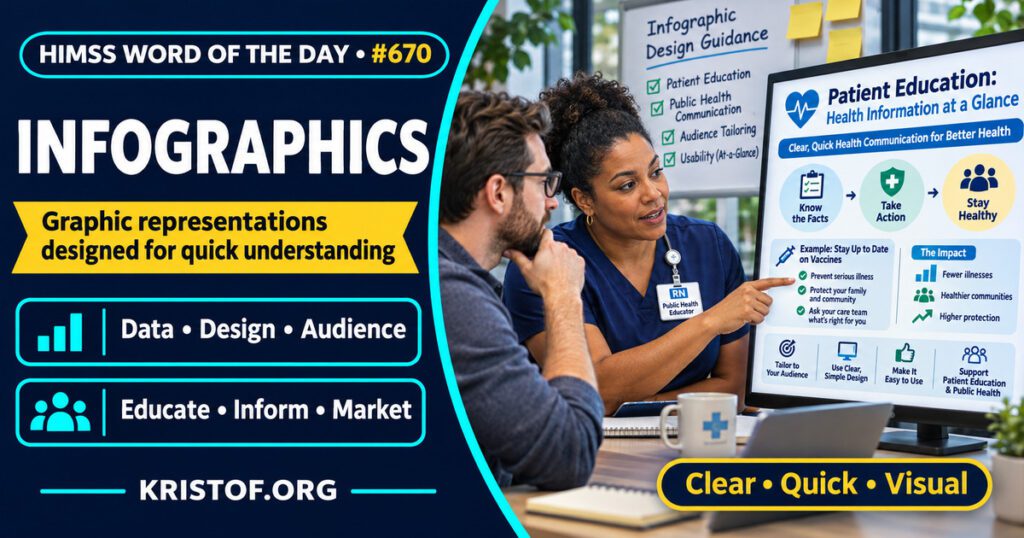
The HIMSS Dictionary describes infographics as graphic representations of information designed so that data can be understood quickly. Because a graphic can carry a lot of information in a small space, the dictionary notes that infographics are attractive for instruction and for marketing.
Kong and colleagues (2025) note that the definitions of infographics in the health literature vary in scope and content, so the term is used loosely.
| Element | What it does | Example in the sources below |
|---|---|---|
| Data | The information to be communicated | Public health statistics, care instructions |
| Design | Layout, visuals, and text arranged for quick reading | Pictorial foot care education |
| Audience | The people the graphic is meant for | Patients, family members, practitioners, residents |
| Purpose | Knowledge, behavior, consent, or teaching | Diabetes foot care, trial consent, tickborne illness teaching |
⚠️ Exam Alert: An infographic is a designed graphic that communicates a message, and it is not the same thing as a dashboard, which typically presents monitored metrics for ongoing use, or a plain chart of one data set. Keep data visualization (the broad practice of displaying data graphically) separate from infographic (one designed form of it).
🌐 Why It Matters: Real-World Healthcare IT Context
What the literature shows. Kong and colleagues (2025) conducted a scoping review of peer-reviewed publications on the development of health infographics. A total of 135 articles met inclusion criteria, and publications increased over time. Of 81 studies that evaluated effectiveness in improving knowledge or changing attitudes or behaviors, 71 (87.7 percent) reported that infographics were effective, and infographics were often preferred over another medium such as text. The authors also say many studies lacked rigor in study design or reporting methods, and that they found no articles focused on the credibility or development of infographic tools. The percentage describes how many studies reported benefit, not how large the benefit was, and weak study designs can overstate it.
A trial. Sharif and colleagues (2025) ran a single-blinded randomized controlled trial of a pictorial, infographic-based foot care education intervention for people with type 2 diabetes at one primary care clinic serving slum communities in Karachi, Pakistan. Of 180 participants, 90 were in each arm, and 83 in the intervention arm and 77 in the control arm completed 3-month follow-up. The mean score difference from baseline was 3.53 in the intervention group (95 percent confidence interval 3.11 to 3.96) and 0.87 in the control group (95 percent confidence interval 0.34 to 1.40). The abstract does not describe the score scale or a clinical outcome such as ulcers, and it is one clinic in one setting.
Designing the tool. Cullen and colleagues (2024) describe a user-centered study to create and evaluate Florence, a public health informatics tool for making infographics. In phase 1, public health practitioners said it was important to tailor infographics to the audience and wanted flexible tools with design guidance. In phase 2, the team built a prototype with a familiar layout, quick ways to change data in visualizations, and health-focused visuals. In phase 3, participants found it usable. The abstract does not give participant numbers or usability scores.
Consent. O’Grady and colleagues (2023) published a study protocol, not results, for co-designing and pilot testing an infographic to support patients and families through the REMAP-CAP intensive care trial consent process. The primary outcome is feasibility. Because it is a protocol, it shows the intent to use infographics for consent, not whether they help.
Teaching. Johnson and Kalantari (2023) describe an emergency medicine residency module in which learners created infographics about tickborne illnesses. Of 22 participants who completed the post-course evaluation, 72.7 percent felt the session increased their knowledge. The pre-test file was lost, so there is no before-and-after comparison, and the authors’ conclusion of effectiveness rests on post-test scores and a satisfaction survey.
What I could not confirm. I did not find a source in this session that shows infographics improve clinical outcomes such as complications or readmissions. The foot care trial reports a score change, and the scoping review reports study-level findings with mixed rigor. I did not review guidance on accessibility or health literacy design, and I read abstracts only.
Common infographic problems:
- Packing too much information into one graphic
- Designing for the author, not the audience
- Missing or unclear sources for the data shown
- Assuming a graphic improves understanding without testing it
- Ignoring accessibility, such as color contrast and alternative text
What supports good infographics:
- Tailoring content to a specific audience
- Involving users, such as patients or practitioners, in design
- Clear data and a stated source
- Testing whether the audience understands the message
- Tools that provide design guidance for non-designers
🏥 The Nurse’s Perspective: Clinical, Bedside, & Workflow
Nurses use graphics every day in teaching, even when they do not call them infographics.
At the Bedside
Patient education is where infographics most often reach nurses. In the Karachi trial, a pictorial foot care intervention was tested against a control, and the intervention group improved more on the score used. The abstract does not say who delivered the education, so the trial does not show what a nurse-led version would achieve.
In Clinical Workflow
Nurse educators can use infographics for staff teaching as well. Johnson and Kalantari (2023) had learners build infographics as an active learning exercise, though they were residents, not nurses, and the evaluation was limited. A nurse educator who tries the same approach would want to include a pre-test and post-test.
In EHR Implementation (Go-Live Perspective)
During an Epic Go-Live, analysts and at-the-elbow support staff often turn workflow changes into short visual quick-reference sheets. This is a workflow observation, and the sources above did not study go-live tip sheets. Following Cullen and colleagues (2024), tailoring the sheet to a specific audience is a sound design starting point.
🎓 CAHIMS / CPHIMS & HIMSS Perspective
CAHIMS Exam Domain Mapping
Infographics appear as a communication and data presentation tool:
| CAHIMS Domain | How Infographics Appear |
|---|---|
| Healthcare & Technology Environments | Design tools and presentation of health data |
| Clinical Informatics | Patient and clinician education and decision communication |
| Healthcare Information & Systems Management | Data presentation, reporting, and communication of metrics |
| Management & Leadership | Public health messaging, training, and stakeholder communication |
Key Terms to Know Alongside Infographics
- Data visualization — the practice of presenting data in graphical form
- Dashboard — a display of key metrics for monitoring performance or status
- Health literacy — the degree to which people can find, understand, and use health information
- Patient education — teaching that helps patients understand and manage their health
- User-centered design — a design approach that involves the intended users throughout
- Usability — how easily and effectively people can use a product or tool
HIMSS Organizational Position
HIMSS offers education and research on health information and technology topics through its Resource Center. Members can find related information on the HIMSS Resource Center page.
🧭 More HIMSS Word of The Day Terms
Related terms in the Data and Analytics series:
Browse all Data and Analytics terms or the A–Z glossary.
🔗 Explore Further: External References
- Kong et al. (2025), Health Communication — Trends in and Effectiveness of Infographics for Health Communication: A Scoping Review https://pubmed.ncbi.nlm.nih.gov/38629448/
- Sharif et al. (2025), BMC Public Health — Effectiveness of pictorial educational intervention on foot care among individuals having type 2 diabetes at slums of Karachi, Pakistan: asingle blinded randomized control trial https://pubmed.ncbi.nlm.nih.gov/41029643/
- Cullen et al. (2024), Journal of the American Medical Informatics Association — Designing an infographic webtool for public health https://pubmed.ncbi.nlm.nih.gov/37354553/
- O’Grady et al. (2023), Pilot and Feasibility Studies — Co-designing and pilot testing an infographic to support patients/families through the REMAP-CAP consent process: a mixed-methods study protocol https://pubmed.ncbi.nlm.nih.gov/37055859/
- Johnson and Kalantari (2023), Journal of Education and Teaching in Emergency Medicine — Flipping Tickborne Illnesses with Infographics https://pubmed.ncbi.nlm.nih.gov/37465658/
- HIMSS — Resource Center https://www.himss.org/resource-center
Term source: HIMSS Dictionary of Health Information and Technology Terms, Acronyms, and Organizations, 6th Edition (2025). All definitions in this series are paraphrased for editorial purposes. Readers are encouraged to consult the primary source for exact language.
Eric Andrew Kristof, RN, CAHIMS is a Healthcare IT professional and HIMSS Arkansas Chapter member based in Hot Springs Village, AR, with hands-on Epic Go-Live experience and a diverse healthcare and IT background. He writes at kristof.org at the intersection of clinical care and healthcare technology.
Leave a Reply