By Eric Andrew Kristof, RN, CAHIMS | Healthcare IT Professional | HIMSS Arkansas Chapter Member
About This Series: The HIMSS Word of The Day is a running blog series drawing from the HIMSS Dictionary of Health Information and Technology Terms, Acronyms, and Organizations, 6th Edition (2025) — the authoritative reference for healthcare IT professionals and the primary study resource for CAHIMS and CPHIMS certification. Each post paraphrases the term in plain language, grounds it in real-world healthcare IT context, and adds a bedside nursing perspective you won’t find in a textbook.
📖 The Term: Cause and Effect Diagram
Source: HIMSS Dictionary of Health Information and Technology Terms, Acronyms, and Organizations, 6th Edition (2025)
🔍 Plain-Language Definition
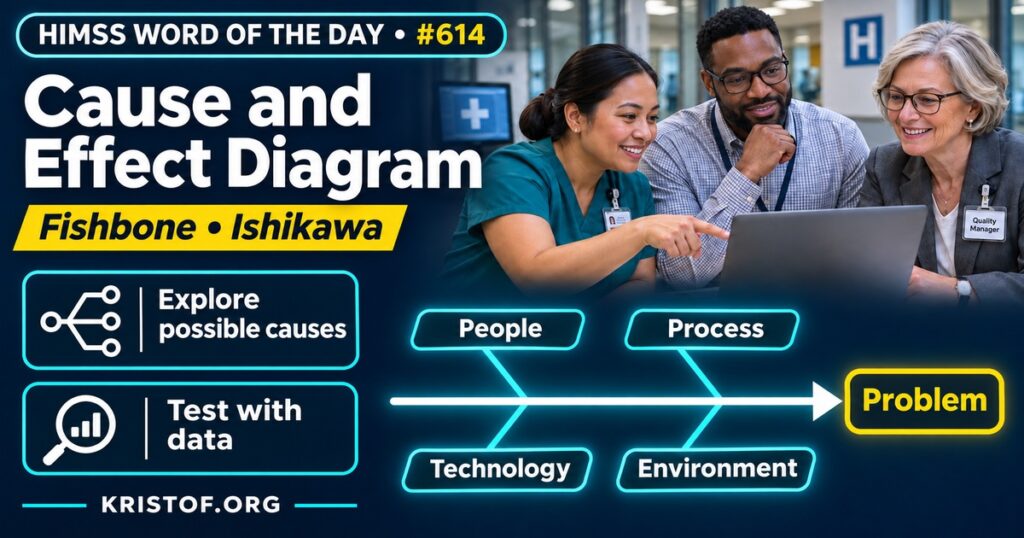
The HIMSS Dictionary describes a cause and effect diagram as a display of the factors thought to influence a particular problem or system outcome. It is often used in quality improvement work or in brainstorming to organize people’s ideas about causes in an orderly way. The dictionary notes that it is also called the fishbone diagram because primary and secondary causes give it that shape. The words “thought to” matter: the diagram lays out possibilities for a team to examine.
ASQ calls the fishbone diagram a quality tool that sorts possible causes of a problem into categories, also known as the cause-and-effect or Ishikawa diagram, and lists it among the seven basic quality tools. The page credits Kaoru Ishikawa and gives no date for its creation. IHI describes it as a graphic tool for exploring and displaying the possible causes of a given effect, and says it helps teams see that many causes can contribute to one effect and how those causes relate to each other.
| Item | Detail |
|---|---|
| What it shows | Possible causes of one problem, grouped under main categories |
| Shape | A horizontal spine pointing to the problem, with category branches and sub-causes |
| Common starting categories | ASQ lists the “6 Ms” (materials, machinery, methods, measurement, manpower, and Mother Nature); IHI lists materials, methods, equipment, environment, and people |
| Typical use | Brainstorming and quality improvement projects |
| Also called | Fishbone diagram and Ishikawa diagram |
⚠️ Exam Alert: The cause and effect diagram organizes possible causes. A Pareto chart helps rank which problems or causes occur most often. FMEA looks ahead at how a process could fail, and root cause analysis is the broader investigation the diagram can feed. Do not treat a branch on the diagram as a proven cause.
🌐 Why It Matters: Real-World Healthcare IT Context
Health IT problems rarely have one cause. A delayed result, a missed alert, or a slow discharge can involve build, workflow, training, devices, policy, and staffing at once. The fishbone gives a team a shared page on which to lay those possibilities out before choosing what to test.
How ASQ describes building one. The team agrees on a problem statement and draws a horizontal spine arrow pointing to it. Main category branches come off the spine, and the group asks “why” repeatedly to add causes beneath each category, with a cause allowed to appear under more than one. When ideas slow down, the team can look at the branches with the fewest entries, then analyze the causes to find root causes rather than symptoms. ASQ says teams should rename categories so they make sense to the people using the diagram, and that on small projects the diagram may be the only tool used, while complex problems call for other tools alongside it. The page was reviewed in October 2024. IHI’s page points to a downloadable template and example instead of listing steps, and shows no date for the tool.
What published health care studies show. The studies below used the tool in particular settings. None of them tests whether the fishbone itself improves outcomes.
- Jebraeily and colleagues (2023) interviewed 21 clinical coders in three cities in Iran and used the five categories of Ishikawa’s diagram as predetermined themes for analysis. They identified 16 root causes across policies and processes, individual factors, equipment and materials, working environment, and management factors, including lack of access to electronic medical records and electronic coding support tools. The findings rest on coders’ reports from one country.
- Wagle and colleagues (2023) used a fishbone diagram within a DMAIC project on hospital transfers for acute type A aortic dissection. The diagram displayed 23 root causes of delays in the transfer decision, and a nominal voting technique narrowed them to four, including lack of a real-time database and incompatible EHR systems between facilities. The abstract describes two proposed solutions, not measured results.
- Sheth and colleagues (2024) report a quality improvement project on medication reconciliation at discharge from a pediatric emergency department and urgent care centers. The team created an Ishikawa diagram to assess potential failures, alongside EHR changes that included a clinical decision support tool, education, and feedback. They report increases in completed medication reconciliation, but because several interventions were used together, the diagram’s own contribution cannot be separated.
- Whiteman and colleagues (2021), writing in Critical Care Nurse, describe the cause and effect diagram alongside the spaghetti diagram, the 5 Whys, and the Pareto chart as critical thinking tools used within the nursing process.
Common cause and effect diagram problems:
- Treating a listed cause as proven without data
- Building it alone, without frontline staff who see the problem
- Using a vague problem statement
- Letting categories force causes into the wrong branch
- Listing many causes with no way to prioritize them
- Blaming individuals when the causes sit in the system
- Stopping at the picture without actions or owners
What supports useful diagrams:
- A specific, agreed problem statement
- Participants from the roles involved, including nurses and analysts
- Category names adapted to the problem, as ASQ advises
- Follow-up with data, such as counts or a Pareto chart
- A clear path from chosen causes to actions and ownership
🏥 The Nurse’s Perspective: Clinical, Bedside, & Workflow
Nurses often see the problem first and can describe it in detail.
At the Bedside
A missed barcode scan, a delayed discharge, or an alert that is routinely overridden often starts as a frontline observation. Bedside nurses supply the details of what happens at the point of care, which is the information a fishbone needs to place causes accurately. The Whiteman article lists the cause and effect diagram among tools used within the nursing process.
In Clinical Workflow
Nurse informaticists often facilitate these sessions after a workflow complaint or safety event. A useful move is renaming the headings to fit the problem, as ASQ advises, so that people, process, technology, and environment questions are all visible. The Sheth project involved informatics and quality staff with physicians and nurses, which is a reminder that the right group is mixed.
In EHR Implementation (Go-Live Perspective)
During an Epic Go-Live, analysts at the elbow hear the same complaint from many users and must sort whether it comes from build, workflow, training, or equipment. A fishbone can help a team lay out those possibilities, and counts of reported issues can then show which branches deserve attention first. This post does not claim that any specific go-live used a cause and effect diagram.
🎓 CAHIMS / CPHIMS & HIMSS Perspective
CAHIMS Exam Domain Mapping
The cause and effect diagram supports quality and improvement knowledge:
| CAHIMS Domain | How the Cause and Effect Diagram Appears |
|---|---|
| Healthcare & Technology Environments | Sorting technology, process, and environment contributors to a problem |
| Clinical Informatics | Clinical workflow problems and patient safety reviews |
| Healthcare Information & Systems Management | Quality improvement methods and issue analysis |
| Management & Leadership | Facilitating groups and assigning ownership of actions |
Key Terms to Know Alongside Cause and Effect Diagram
- Root cause analysis — a structured investigation into the underlying causes of a problem or event
- FMEA — a method for examining how a process could fail and what the effects would be
- Pareto chart — a chart that ranks causes or problems by how often they occur
- 5 Whys — a questioning technique that asks why repeatedly to move past symptoms
- DMAIC — the define, measure, analyze, improve, and control improvement cycle
- Quality improvement — organized work to improve a process or outcome over time
HIMSS Organizational Position
HIMSS offers education and research on health information and technology topics through its Resource Center. Members can find related information on the HIMSS Resource Center page.
🧭 More HIMSS Word of The Day Terms
Related terms in the Project and Change Management series:
Browse all Project and Change Management terms or the A–Z glossary.
🔗 Explore Further: External References
- ASQ — Fishbone Diagram (Cause-and-Effect or Ishikawa Diagram) https://asq.org/quality-resources/fishbone
- IHI — Cause and Effect Diagram https://www.ihi.org/library/tools/cause-and-effect-diagram
- Jebraeily et al. (2023), Health information management journal — Identification of root causes of clinical coding problems in Iranian hospitals https://pubmed.ncbi.nlm.nih.gov/34913392/
- Wagle et al. (2023), Cureus — Improving the Hospital Transfer Process for Acute Type A Aortic Dissections https://pubmed.ncbi.nlm.nih.gov/36751239/
- Sheth et al. (2024), Pediatrics — Standardizing Medication Reconciliation in a Pediatric Emergency Department https://pubmed.ncbi.nlm.nih.gov/38273780/
- Whiteman et al. (2021), Critical care nurse — Critical Thinking Tools for Quality Improvement Projects https://pubmed.ncbi.nlm.nih.gov/33791767/
- HIMSS — Resource Center https://www.himss.org/resource-center
Term source: HIMSS Dictionary of Health Information and Technology Terms, Acronyms, and Organizations, 6th Edition (2025). All definitions in this series are paraphrased for editorial purposes. Readers are encouraged to consult the primary source for exact language.
Eric Andrew Kristof, RN, CAHIMS is a Healthcare IT professional and HIMSS Arkansas Chapter member based in Hot Springs Village, AR, with hands-on Epic Go-Live experience and a diverse healthcare and IT background. He writes at kristof.org at the intersection of clinical care and healthcare technology.
Leave a Reply