By Eric Andrew Kristof, RN, CAHIMS | Healthcare IT Professional | HIMSS Arkansas Chapter Member
About This Series: The HIMSS Word of the Day is a running blog series drawing from the HIMSS Dictionary of Health Information and Technology Terms, Acronyms, and Organizations, 6th Edition (2025) — the authoritative reference for healthcare IT professionals and the primary study resource for CAHIMS and CPHIMS certification. Each post paraphrases the term in plain language, grounds it in real-world healthcare IT context, and adds a bedside nursing perspective you won’t find in a textbook.
📖 The Term: Gantt Chart
Source: HIMSS Dictionary of Health Information and Technology Terms, Acronyms, and Organizations, 6th Edition (2025)
🔍 Plain-Language Definition
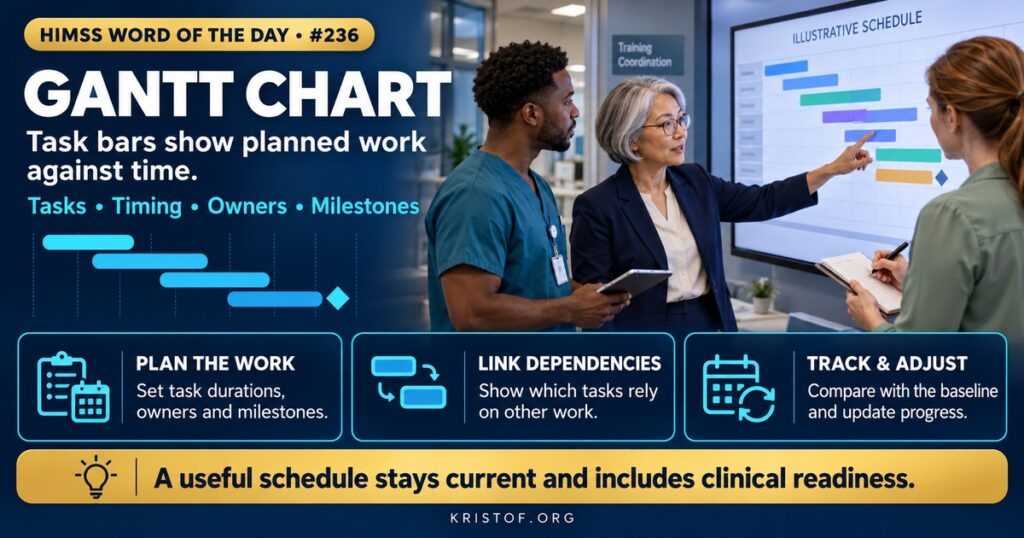
A Gantt chart is a type of bar chart used to plan and control a process or project. According to the HIMSS Dictionary, it displays planned completion targets in relation to time, typically showing the week, month, or quarter when each activity will finish and who is responsible. In everyday use, each row is a task, each bar spans its start and end dates, and a vertical line marks today’s date so the team can see what should already be done.
Most project tools add features on top of the basic bars: milestones, dependencies between tasks, percent complete, resource assignments, and a baseline that preserves the original plan for comparison.
| Element | What It Shows | Why It Helps |
|---|---|---|
| Task bar | Start, end, and duration of an activity | Makes workload and sequence visible |
| Milestone | A key date such as sign-off or go-live | Marks decision points |
| Dependency | One task must finish before another starts | Reveals knock-on delays |
| Baseline | The original approved schedule | Allows variance tracking |
| Resource or owner | Person or team responsible | Clarifies accountability |
| Today line | The current date | Shows what is late or ahead |
⚠️ Exam Alert: A Gantt chart shows schedule and sequence. The critical path is the longest chain of dependent tasks that sets the earliest finish date. A work breakdown structure (WBS) lists deliverables, while a Gantt chart places the resulting tasks on a calendar. A Gantt chart does not by itself show cost or risk.
🌐 Why It Matters: Real-World Healthcare IT Context
Health IT projects involve many parties: clinicians, analysts, vendors, interface teams, trainers, and executives. Each group works on its own timeline, but the dates depend on each other. Build cannot be tested until it exists, training cannot happen until the system is stable enough to teach, and go-live cannot move without staffing, device, and downtime plans in place. A Gantt chart puts those dependencies on one page, which is why it is a standard tool for EHR implementations, upgrades, interface projects, and device rollouts.
Published clinical examples show the same tool in non-IT projects. A French university hospital moving from Luer connectors to the safer NRFIT standard for neuraxial applications planned its deployment with a Gantt chart, along with a communication and training plan and a temporary three-month buffer stock of the new devices. Of 65 existing device references, 44 were retained and converted to NRFIT equivalents in a two-phase rollout in July and August 2025. The authors reported that multidisciplinary coordination and detailed planning were key success factors, and that supplier delays and patients transferred from hospitals with Luer devices required special protocols. A Pakistani hospital that wanted to admit children with airborne infections used a Gantt chart as a quality tool within a Six Sigma DMAIC project that began in October 2015. During six months after isolation rooms were established, 62 suspected or confirmed measles cases were admitted, and only four needed referral elsewhere. These are single-site reports, but they show the chart doing its job: making a multistep change visible and trackable.
The chart has limits. A bar shows when work is planned, not whether the plan is realistic. Teams often fill the schedule with optimistic durations, and if dependencies are not entered, the chart will not warn them when a slipped task endangers the go-live date. A chart that is not updated becomes decoration. A chart with hundreds of rows becomes unreadable for executives and clinicians, who need a summary view of major phases and milestones. Gantt charts also say little about risk, scope, or quality, which need their own logs and reviews.
Good practice is to keep a detailed schedule for the project team and a simplified roll-up for sponsors and frontline leaders. Set a baseline at approval, update progress on a regular rhythm, and review variance in meetings where decisions can be made. Include clinical readiness tasks, such as unit walkthroughs, competency checks, super user training, and downtime drills, not just technical ones. Check the schedule against known clinical calendars, since a go-live scheduled during a surge season or a staffing shortage can be technically on time and operationally unsafe.
Federal resources reinforce the importance of planning. The Health IT Playbook from the Office of the National Coordinator offers guidance on adopting and using health IT, and the SAFER Guides provide self-assessments that include implementation and organizational readiness considerations. A schedule is where those expectations become dated, owned tasks.
Common Gantt chart problems:
- Schedules built once and never updated
- Missing dependencies, so slips are not visible
- Clinical readiness tasks left off the plan
- Too much detail for leaders, too little for task owners
- Optimistic estimates with no buffer
- Status reported as percent complete without evidence
What supports a useful schedule:
- A baseline and a regular update rhythm
- Dependencies and a known critical path
- Milestones with clear exit criteria
- A summary view for sponsors and a detailed view for the team
- Owners who are named and who confirm their dates
- Clinical calendars and staffing considered in date setting
🏥 The Nurse’s Perspective: Clinical, Bedside, & Workflow
Nurses meet Gantt charts when units are asked to prepare for a change, and they can improve the plan by speaking up early.
At the Bedside
A bar labeled training or go-live readiness becomes real days when staff must leave the floor for classes, practice sessions, or competency checks. Nurses can tell planners when those days collide with high census periods, holidays, or other projects. Early feedback prevents plans that look fine on paper but cannot be staffed.
Staff also benefit from seeing a simplified timeline so they know when to expect new devices, workflow changes, and downtime.
In Clinical Workflow
Nurse managers and educators map unit tasks onto the project schedule: staffing for classes, super user availability, supply and device checks, and policy updates. They also flag dependencies that planners may not see, such as a unit renovation or a new hire cohort.
Nurse informaticists often own the clinical tasks within the plan, such as workflow validation sessions and order set reviews. They keep estimates realistic and report slippage promptly so that dates can be adjusted with clinical risk in mind.
In EHR Implementation (Go-Live Perspective)
An Epic Go-Live plan contains hundreds of tasks across build, testing, training, cutover, and support. Command center teams track the cutover timeline hour by hour, and at-the-elbow support schedules follow a visual plan by unit and shift. When a task slips, such as late device delivery or unfinished training, the schedule shows what else is affected and gives leaders time to decide whether to adjust, add resources, or delay.
🎓 CAHIMS / CPHIMS & HIMSS Perspective
CAHIMS Exam Domain Mapping
Gantt charts appear in project management and implementation questions:
| CAHIMS Domain | How the Gantt Chart Appears |
|---|---|
| Healthcare & Technology Environments | Project and implementation lifecycles, planning tools |
| Clinical Informatics | Workflow validation, training schedules, clinical readiness |
| Healthcare Information & Systems Management | System build, testing, cutover, resource planning |
| Management & Leadership | Scheduling, baselines, status reporting, change management |
Key Terms to Know Alongside the Gantt Chart
- Critical Path — longest sequence of dependent tasks that determines the project end date
- Milestone — significant event or decision point in a project
- Work Breakdown Structure (WBS) — hierarchical list of project deliverables and tasks
- Baseline — approved schedule used to measure progress
- Dependency — relationship in which one task relies on another
- Project Charter — document that authorizes a project and states its goals
HIMSS Organizational Position
HIMSS supports project and change management skills through its education, professional development, and community work. Members can find related resources through the HIMSS Resource Center.
🔗 Explore Further: External References
- HealthIT.gov — Health IT Playbook https://www.healthit.gov/playbook/
- HealthIT.gov — Health IT Playbook: Electronic Health Records https://www.healthit.gov/playbook/electronic-health-records/
- HealthIT.gov — SAFER Guides https://healthit.gov/clinical-quality-and-safety/safer-guides/
- Garbil et al. (2026), Annales Pharmaceutiques Françaises — Securing the Administration of Anesthetics With the Implementation of NRFIT Connectors: Experience in a French University Hospital https://pubmed.ncbi.nlm.nih.gov/42162835/
- Mohammad et al. (2020), Journal of the Pakistan Medical Association — Paediatric Respiratory Isolation: A Challenge for a Secondary Care Hospital! A Service Innovation Project https://pubmed.ncbi.nlm.nih.gov/32296211/
Term source: HIMSS Dictionary of Health Information and Technology Terms, Acronyms, and Organizations, 6th Edition (2025). All definitions in this series are paraphrased for editorial purposes. Readers are encouraged to consult the primary source for exact language.
Eric Andrew Kristof, RN, CAHIMS is a Healthcare IT professional and HIMSS Arkansas Chapter member based in Hot Springs Village, AR, with hands-on Epic Go-Live experience and a diverse healthcare and IT background. He writes at kristof.org at the intersection of clinical care and healthcare technology.
Leave a Reply