By Eric Andrew Kristof, RN, CAHIMS | Healthcare IT Professional | HIMSS Arkansas Chapter Member
About This Series: The HIMSS Word of The Day is a running blog series drawing from the HIMSS Dictionary of Health Information and Technology Terms, Acronyms, and Organizations, 6th Edition (2025) — the authoritative reference for healthcare IT professionals and the primary study resource for CAHIMS and CPHIMS certification. Each post paraphrases the term in plain language, grounds it in real-world healthcare IT context, and adds a bedside nursing perspective you won’t find in a textbook.
📖 The Term: Scatter Plot
Source: HIMSS Dictionary of Health Information and Technology Terms, Acronyms, and Organizations, 6th Edition (2025)
🔍 Plain-Language Definition
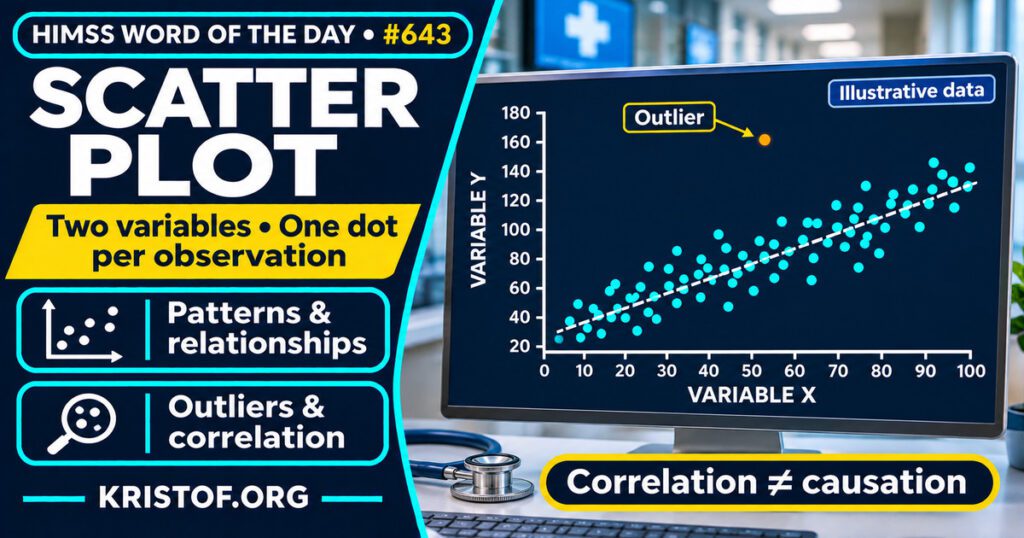
The HIMSS Dictionary describes a scatter plot as a graph that shows data along two dimensions, using dots to stand for the values measured on two different variables. In other words, each observation, such as a patient, a visit, or a unit-day, becomes one dot, positioned by its value on a horizontal axis and its value on a vertical axis.
The NIST/SEMATECH Engineering Statistics Handbook explains that a scatter plot graphs the values of Y against matching values of X, with Y on the vertical axis, usually the response variable, and X on the horizontal axis, a variable suspected of being related to it. The handbook says the plot can help answer whether X and Y are related, whether the relationship is linear or non-linear, whether the spread of Y changes with X, and whether outliers are present. A relationship shows up as a non-random pattern in the dots.
| Element | What it means |
|---|---|
| Dot | One observation with a value for each of two variables |
| Horizontal axis (X) | The variable suspected of being related to the response |
| Vertical axis (Y) | Usually the response variable |
| Pattern | Linear, curved, clustered, or no visible structure |
| Outlier | A dot far from the others |
| Fitted line | An optional line summarizing the trend, which should stay within the observed data |
The table is a simplified summary of the dictionary and the NIST/SEMATECH Handbook.
⚠️ Exam Alert: A scatter plot shows the relationship between two continuous variables across individual observations. A line graph usually follows one measure over time, a bar chart compares categories, a histogram shows the distribution of one variable, and a Gantt chart shows a schedule. Also remember that correlation is not causation: the NIST handbook says a scatter plot can suggest a mechanism but cannot prove cause and effect.
🌐 Why It Matters: Real-World Healthcare IT Context
Scatter plots matter in health IT because analytics work often starts with the question of whether two measures move together. They are also a safeguard against summary numbers that hide the shape of the data.
What studies show. Weissgerber and colleagues (2015), in PLoS Biology, conducted a systematic review of 703 articles in top physiology journals and found that most presented continuous data in bar and line graphs. Papers rarely included scatterplots, box plots, or histograms that let readers evaluate continuous data critically. The authors note that many different data distributions can produce the same bar or line graph, so the full data may suggest different conclusions from the summary statistics. They recommend more complete data presentation. This review covers physiology journals and small-sample studies, so it should not be read as a measure of all health reporting.
Kuo (2002), in JAMA, reviewed articles published from January through June 2000 in BMJ, JAMA, The Lancet, and the New England Journal of Medicine. Of 178 articles with at least one scatterplot, 37 had a scatterplot showing raw data with a fitted regression line. Among those, 22 (59 percent) involved extrapolation, meaning a fitted line extended beyond the observed data, and none changed the line type to indicate it. Four articles (11 percent) contained a line that reached unreasonable or meaningless values, and three (8 percent) stated explicit conclusions about values outside the observed range. This is a single six-month sample from four journals from 2000.
Ciccione and colleagues (2023), in the Journal of Experimental Psychology: Human Perception and Performance, tested how adults judge trends in scatterplots containing outliers across three experiments. Outliers biased people’s trend judgments when the participants did not spontaneously reject them, and the bias remained, though smaller, when the participants were asked to exclude them. In the third experiment, the participants detected outliers well but continued to be biased by them unless they were far from the main trend. These are laboratory perception experiments with brief displays, not studies of clinical data.
What I could not find. I did not find a study of how often scatter plots are used or misread in hospital analytics dashboards or EHR reports. Two further PubMed items that I located, a statistics column by Sainani (2016) and a journal drawing guideline by Kim and colleagues (2024), had abstracts too short to cite for specific findings, so I did not use them.
Common scatter plot problems:
- Reading a pattern as proof that one variable causes the other
- Extending a fitted line beyond the observed data without marking it
- Letting a few outliers drive the apparent trend
- Plotting overlapping points so dense areas look sparse
- Showing only a summary graph when individual points would tell more
- Leaving out axis labels, units, or the number of observations
What supports good scatter plot practice:
- Plotting individual observations, especially in small samples
- Labeling axes with units and showing the sample size
- Checking for outliers and deciding in advance how to handle them
- Keeping any fitted line within the range of the data, or marking extrapolation clearly
- Pairing the plot with the underlying statistics, not replacing them
- Using subject-matter knowledge before drawing conclusions about cause
🏥 The Nurse’s Perspective: Clinical, Bedside, & Workflow
Nurses meet scatter plots in quality reports, research articles, and unit dashboards more than at the bedside.
At the Bedside
Most bedside charting displays trends as line graphs over time, such as vital signs. A scatter plot answers a different question, which is how two measures relate across many patients or units. The habit that carries over is to look at the individual points and not only the trend line.
In Clinical Workflow
Quality and nursing leadership teams sometimes compare two unit-level measures on one chart. A hypothetical example is plotting each unit’s staffing level against its fall rate. Such a plot can suggest a relationship worth studying, but it cannot show that one causes the other, and a few unusual units can pull the apparent trend.
In EHR Implementation (Go-Live Perspective)
During an Epic Go-Live, analysts and nurse leaders review early data on documentation completion, alert volume, or help requests. A scatter plot of two such measures by unit can point to where to look first. This post does not claim that any specific go-live used one. It shows why the plot’s limits, including outliers and small samples, matter when decisions follow.
🎓 CAHIMS / CPHIMS & HIMSS Perspective
CAHIMS Exam Domain Mapping
A scatter plot connects data literacy, analytics, and clinical decision making:
| CAHIMS Domain | How Scatter Plot Appears |
|---|---|
| Healthcare & Technology Environments | Visualization tools and reporting platforms used in health systems |
| Clinical Informatics | Interpreting relationships between clinical measures without assuming cause |
| Healthcare Information & Systems Management | Building and checking dashboards and reports for data quality |
| Management & Leadership | Using visual evidence responsibly in quality and operations decisions |
Key Terms to Know Alongside Scatter Plot
- Data visualization — presenting data in a graphic form so patterns are easier to see
- Dashboard — a display that brings key measures together in one view
- Correlation — a statistical measure of how two variables move together
- Regression — a method for fitting a line or curve that describes how one variable relates to another
- Outlier — an observation far from the others
- Gantt chart — a bar chart that shows a project schedule
HIMSS Organizational Position
HIMSS offers education and research on health information and technology topics through its Resource Center. Members can find related information on the HIMSS Resource Center page.
🧭 More HIMSS Word of The Day Terms
Related terms in the Data and Analytics series:
Browse all Data and Analytics terms or the A–Z glossary.
🔗 Explore Further: External References
- NIST/SEMATECH e-Handbook of Statistical Methods — Scatter Plot https://www.itl.nist.gov/div898/handbook/eda/section3/scatterp.htm
- Weissgerber et al. (2015), PLoS Biology — Beyond bar and line graphs: time for a new data presentation paradigm https://pubmed.ncbi.nlm.nih.gov/25901488/
- Kuo (2002), JAMA — Extrapolation of correlation between 2 variables in 4 general medical journals https://pubmed.ncbi.nlm.nih.gov/12038921/
- Ciccione et al. (2023), Journal of Experimental Psychology: Human Perception and Performance — Outlier detection and rejection in scatterplots: Do outliers influence intuitive statistical judgments? https://pubmed.ncbi.nlm.nih.gov/36395054/
- HIMSS — Resource Center https://www.himss.org/resource-center
Term source: HIMSS Dictionary of Health Information and Technology Terms, Acronyms, and Organizations, 6th Edition (2025). All definitions in this series are paraphrased for editorial purposes. Readers are encouraged to consult the primary source for exact language.
Eric Andrew Kristof, RN, CAHIMS is a Healthcare IT professional and HIMSS Arkansas Chapter member based in Hot Springs Village, AR, with hands-on Epic Go-Live experience and a diverse healthcare and IT background. He writes at kristof.org at the intersection of clinical care and healthcare technology.
Leave a Reply