By Eric Andrew Kristof, RN, CAHIMS | Healthcare IT Professional | HIMSS Arkansas Chapter Member
About This Series: The HIMSS Word of the Day is a running blog series drawing from the HIMSS Dictionary of Health Information and Technology Terms, Acronyms, and Organizations, 6th Edition (2025) — the authoritative reference for healthcare IT professionals and the primary study resource for CAHIMS and CPHIMS certification. Each post paraphrases the term in plain language, grounds it in real-world healthcare IT context, and adds a bedside nursing perspective you won’t find in a textbook.
📖 The Term: Dashboard
Source: HIMSS Dictionary of Health Information and Technology Terms, Acronyms, and Organizations, 6th Edition (2025)
🔍 Plain-Language Definition
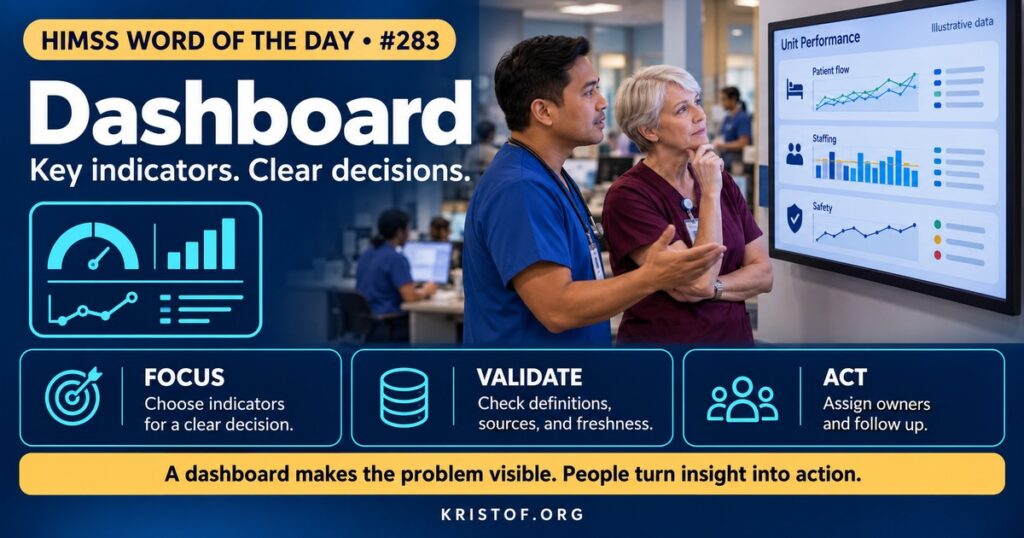
A dashboard is a screen or web page that presents a current, usually visual, snapshot of the key facts about how something is progressing and performing. The HIMSS Dictionary notes that an executive dashboard is a visual tool that helps leaders manage daily affairs, and that in general a dashboard is a tool that represents data visually for a specific use. The word comes from the instrument panel of a vehicle: a few gauges that show what the driver needs to know.
In health care, dashboards appear in several forms. Operational dashboards show real-time flow, such as emergency department census or bed status. Clinical dashboards summarize a patient or a panel, for example blood pressure trends or overdue screenings. Quality dashboards track measures such as falls, infections, and readmissions. Executive dashboards bring together financial, quality, and workforce indicators for leaders. Public reporting dashboards present quality information to consumers.
| Dashboard Type | Primary Audience | Example Content |
|---|---|---|
| Operational | Charge nurses, bed managers | Census, waiting times, discharges pending |
| Clinical | Clinicians | Vital sign trends, patient-generated data |
| Quality and safety | Unit leaders, quality teams | Falls, pressure injuries, infection rates |
| Executive | Senior leaders | Margin, volume, patient experience, staffing |
| Public reporting | Patients and families | Hospital quality ratings |
⚠️ Exam Alert: A dashboard displays indicators; it is not the same as a report, which is usually a detailed, static listing, or a data warehouse, which stores the data. A key performance indicator (KPI) is a measure chosen to show progress toward a goal. Dashboards depend on data quality: a clear display of wrong data is still wrong.
🌐 Why It Matters: Real-World Healthcare IT Context
Health care generates more data than anyone can read. Dashboards promise to filter and summarize so that people see what matters when they can act on it. The promise is real, but the evidence shows that results depend on design and workflow.
Clinician preferences are documented. A 2023 scoping review in Applied Clinical Informatics examined dashboards that display patient-generated health data, such as home blood pressure and activity data, for clinicians’ decision-making. After screening 468 titles and abstracts and 63 full-text papers, the authors included 15 articles. Users preferred statistical summaries and clinical interpretations shown alongside other non-patient-generated data. Recurring themes were a desire for longitudinal display, multiple data types on the same screen, actionability, and customization. Speed, simplicity, and availability of the data for other purposes, such as documentation, were key to adoption. Evaluations were favorable for common graph and table formats, though best practices for implementation had not yet been established. The lesson is to start with how clinicians make decisions and not with what the system can chart.
A real-world pilot shows the limits of a dashboard alone. A 2026 study in the Journal of the American Pharmacists Association built an EHR dashboard of unreconciled controlled substance dispenses, meaning dispenses with no documented administration or with mismatched amounts, and integrated it into the workflow of nursing leaders on several pilot units. Managers were expected to speak with nurses who had unreconciled dispenses and re-educate them on documentation. Before the dashboard, 256 of 26,101 dispenses (0.98 percent) were unreconciled; afterward, 211 of 24,731 (0.85 percent), a decrease of 0.13 percentage points that was not statistically significant (P = 0.14). The authors concluded that dashboards have potential to improve documentation but that workflow barriers can reduce use and engagement. A dashboard makes a problem visible; a person must still act on it.
Public reporting adds another dimension. A 2026 systematic review in JMIR Medical Informatics of digital public reporting systems included 25 empirical studies. It noted that adoption of public reporting systems remains low and may reflect misalignment between the information provided and what users need. Forty percent of the studies examined website presentation formats, 20 percent examined dashboard-based presentation, and 48 percent examined data quality. The review suggested that standardized website and dashboard guidelines improve data reliability and user comprehension, and that dashboards can reduce inconsistencies across web pages. The point for organizations is that how data are displayed affects how they are understood.
Good dashboard practice begins with a clear question and audience: who will use this, to make which decision, how often? Indicators should be defined precisely, with numerators, denominators, data sources, refresh times, and owners. Visual design should favor simple charts, consistent scales, color used sparingly and accessibly, and the ability to drill down to patient lists when action is needed. Too many metrics bury the signal. Governance should include data stewards, change control for definitions, and review of whether a dashboard is used. Data quality checks matter, since a dashboard built on inconsistent documentation can mislead. And dashboards should come with a plan: thresholds that trigger action, named owners, and a process for follow-up. Accessibility requirements, such as those discussed in the earlier post on Section 508, apply to dashboards used by staff with disabilities.
Common dashboard problems:
- Too many metrics and no clear audience or decision
- Indicators defined differently in different dashboards
- Stale or delayed data presented as current
- No owner or action plan when a metric moves
- Color and chart choices that confuse or exclude users
- Metrics that reward documentation behavior more than care
What supports useful dashboards:
- A defined audience, question, and decision
- Precise indicator definitions and data owners
- Simple visuals with drill-down to patient lists
- Embedding in existing workflows and meetings
- Data quality monitoring behind the display
- Periodic review to retire unused dashboards
🏥 The Nurse’s Perspective: Clinical, Bedside, & Workflow
Nurses both feed dashboards and rely on them.
At the Bedside
Many unit dashboards are built from what nurses document: assessments, vital signs, medication administration, and fall risk scores. Timely, accurate documentation makes the dashboard true. A patient-level dashboard, such as a view of a patient’s pain scores over a shift, helps the nurse spot trends and communicate with the team.
In Clinical Workflow
Nurse managers use unit dashboards in daily huddles to look at falls, pressure injuries, call light response, staffing, and discharge readiness. The most useful ones show a handful of indicators, update quickly, and link to the list of patients behind the number. As the controlled substance pilot illustrates, a dashboard works when it is built into a leader’s routine, with clear expectations for what to do about what it shows.
Nurse informaticists work with managers to define indicators, test that dashboards match the chart, and tune displays so they are quick to read. They help retire dashboards that no one uses and avoid building many that show the same thing differently.
In EHR Implementation (Go-Live Perspective)
An Epic Go-Live changes where data are documented, so dashboards need rebuilding and validation early. At-the-elbow support analysts hear when a unit’s numbers do not match staff experience, often because an assessment is charted in a new location, and they help trace it. Early dashboards for go-live itself, such as ticket volume and top issues, guide command center decisions.
🎓 CAHIMS / CPHIMS & HIMSS Perspective
CAHIMS Exam Domain Mapping
Dashboards appear in analytics, usability, and performance management questions:
| CAHIMS Domain | How Dashboards Appear |
|---|---|
| Healthcare & Technology Environments | Public reporting, quality programs, transparency |
| Clinical Informatics | Clinical decision support, visualization, human factors |
| Healthcare Information & Systems Management | Data sources, refresh, business intelligence tools, data quality |
| Management & Leadership | KPIs, governance, performance improvement, accountability |
Key Terms to Know Alongside Dashboard
- Key Performance Indicator (KPI) — measure used to track progress toward a goal
- Data Visualization — graphic presentation of data to aid understanding
- Drill-Down — moving from a summary view to underlying detail
- Business Intelligence — tools and practices for analyzing data for decisions
- Data Steward — person accountable for the quality and definition of data
- Audit and Feedback — returning performance data to clinicians to improve practice
HIMSS Organizational Position
HIMSS supports data-driven decision making through its Analytics Maturity Assessment Model, research, and education. Members can find related resources through the HIMSS Resource Center.
🔗 Explore Further: External References
- Shenvi et al. (2023), Applied Clinical Informatics — Visualization of Patient-Generated Health Data: A Scoping Review of Dashboard Designs https://pubmed.ncbi.nlm.nih.gov/37704021/
- Le et al. (2026), Journal of the American Pharmacists Association — Utilization of an Electronic Health Record Dashboard Report to Monitor Unreconciled Controlled Substance Dispenses https://pubmed.ncbi.nlm.nih.gov/41175973/
- Du et al. (2026), JMIR Medical Informatics — Digital Public Reporting Systems for Evaluating Health Care Quality: Systematic Review https://pubmed.ncbi.nlm.nih.gov/41849199/
- NIST — Health Information Technology Usability https://www.nist.gov/programs-projects/health-information-technology-usability
- HIMSS — Analytics Maturity Assessment Model (AMAM) https://www.himss.org/maturity-models/amam
Term source: HIMSS Dictionary of Health Information and Technology Terms, Acronyms, and Organizations, 6th Edition (2025). All definitions in this series are paraphrased for editorial purposes. Readers are encouraged to consult the primary source for exact language.
Eric Andrew Kristof, RN, CAHIMS is a Healthcare IT professional and HIMSS Arkansas Chapter member based in Hot Springs Village, AR, with hands-on Epic Go-Live experience and a diverse healthcare and IT background. He writes at kristof.org at the intersection of clinical care and healthcare technology.
Leave a Reply